
How it works
How Strategenia works
Strategenia is built on three building blocks: a reference model of your organization, a living digital twin, and an engine that tells you where to act first.
Three building blocks, one system
The reference model
13 domains and 63 cells break your organization down into concrete, measurable capabilities. It’s the shared map everything else builds on.
The digital twin
Each cell is scored for maturity from 0 to 4. A rating declared by your team can be corroborated by real data: confidence rises as the evidence comes in.
The engine
It prioritizes on three factors: the gap to close, the leverage on offer, and the urgency. You get a short list of actions, in the right order.
The product, in pictures
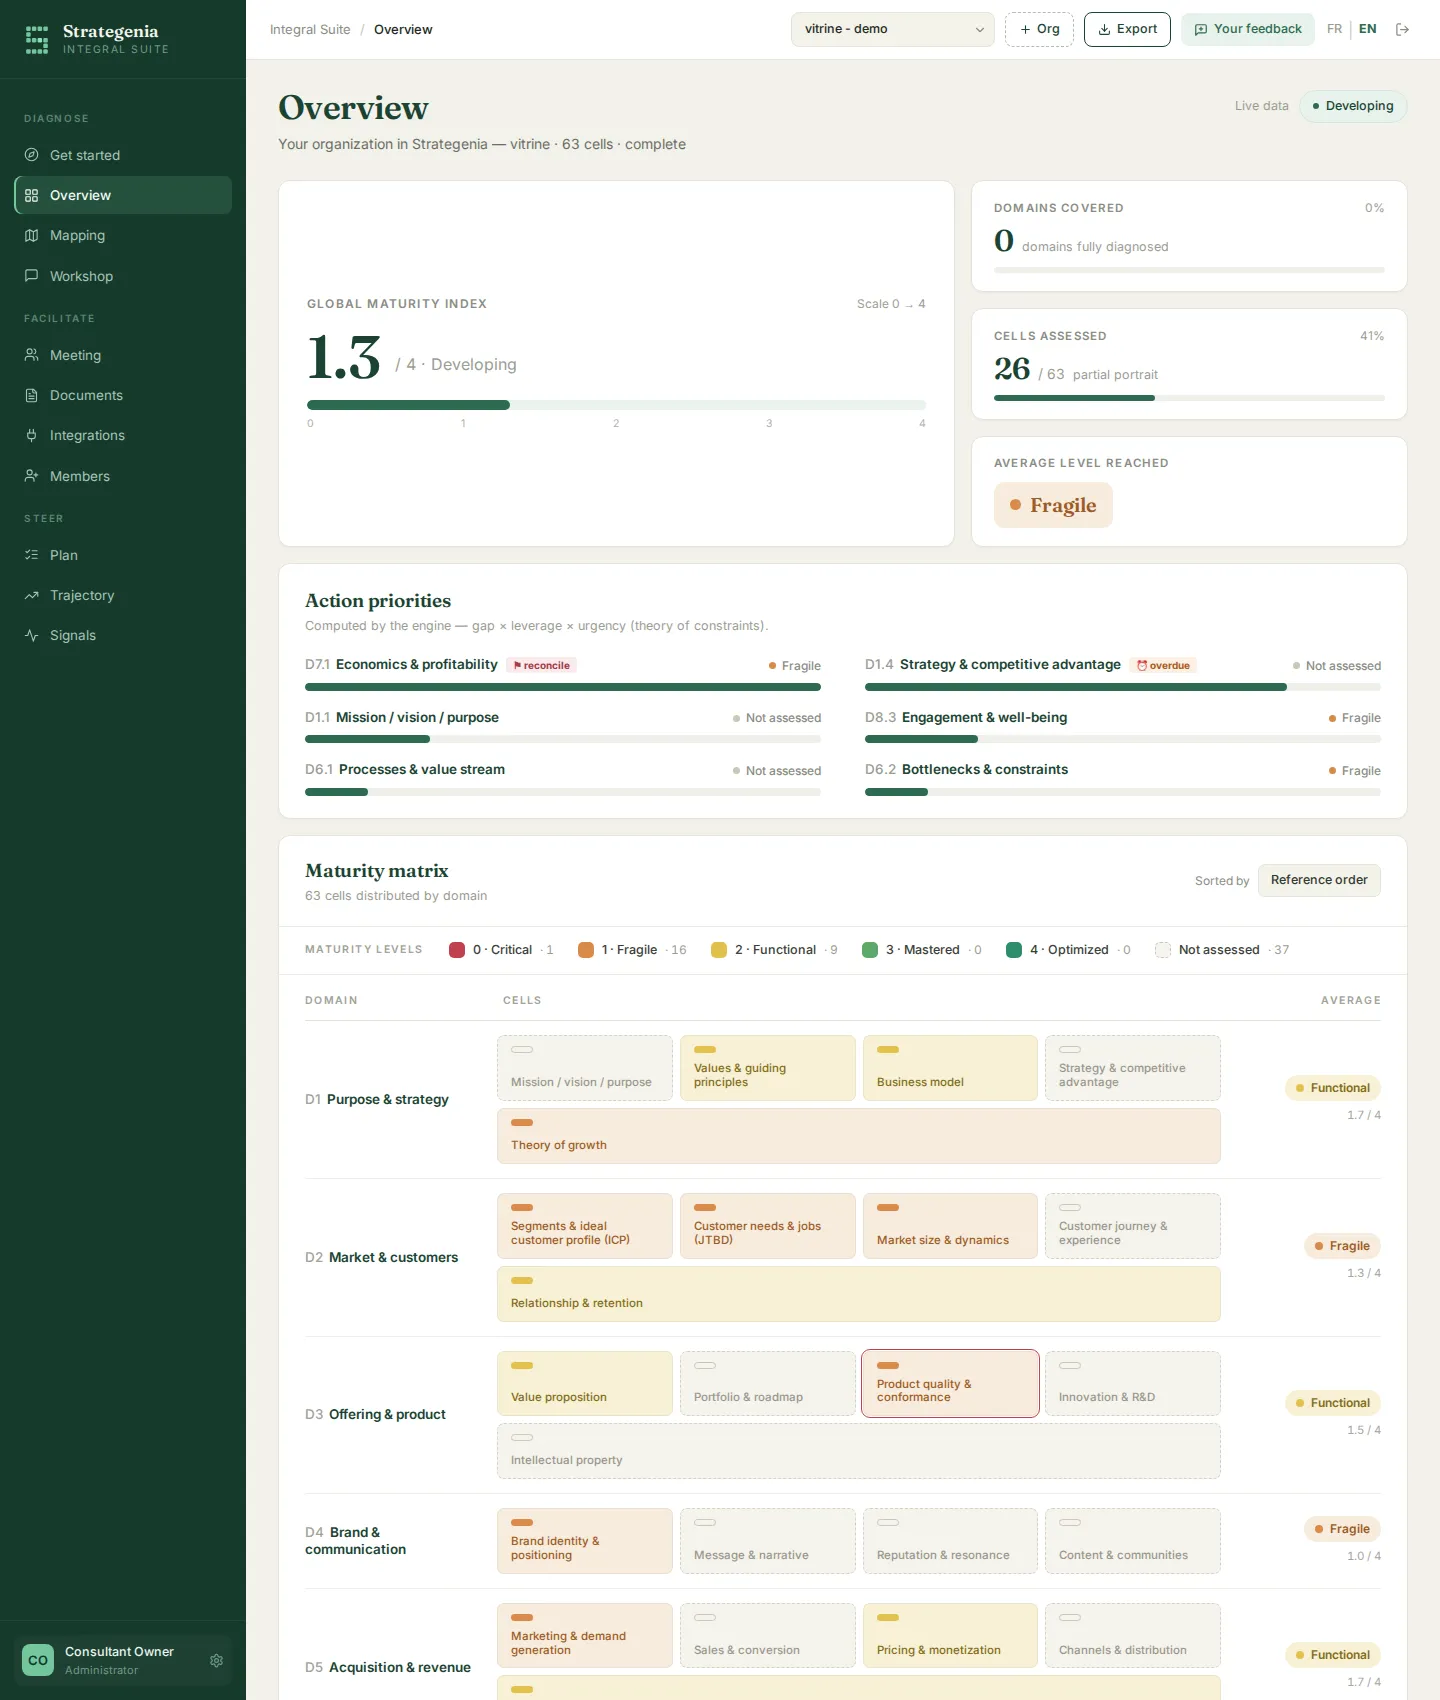
The maturity map: 63 cells, from red to green, and the priorities calculated by the engine.
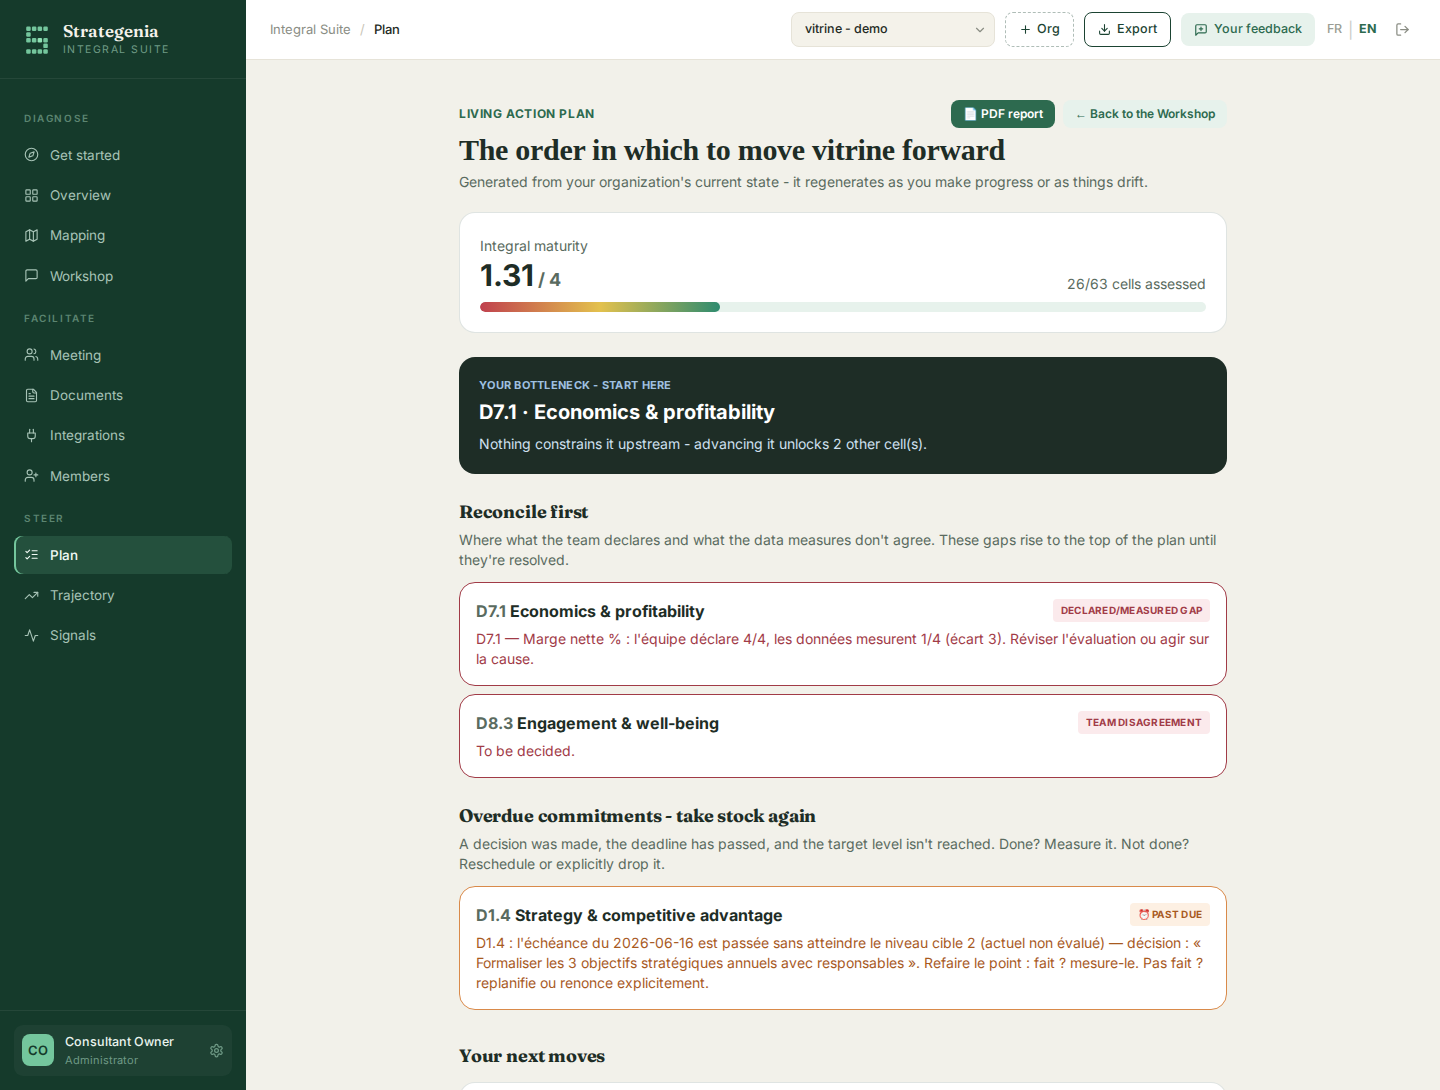
The living action plan: your next moves, in the right order.
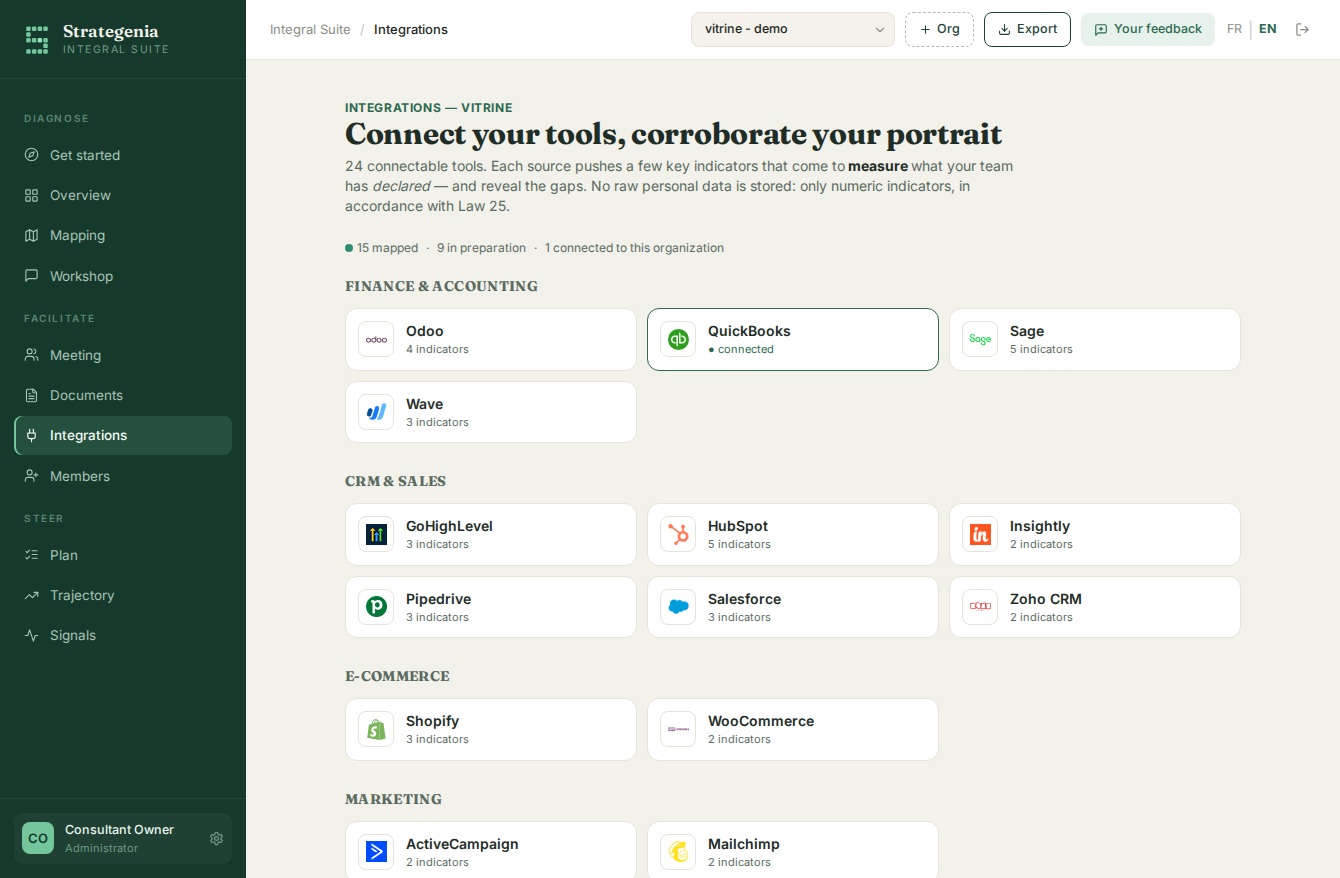
Integrations: your tools corroborate the picture — QuickBooks, HubSpot, Shopify and 20+ others.
The principle: the declared, corroborated by the measured
Your team’s perception matters. So do the numbers. When the two diverge, the gap isn’t settled in a meeting: it rises to the top of the plan.
How you feed the picture
In a workshop
Your team assesses the cells together, in a single session.
Meeting mode
Paste in a transcript; it’s automatically routed to the right cells.
Documents
Upload your reports; their content enriches the relevant cells.
Connectors
Connect QuickBooks, HubSpot, Shopify and 20+ other tools: their numbers become your measured maturity.
Where the measured data comes from
Each connected tool pushes a few key indicators to the relevant cells — that’s the raw material of the “measured.”
Finance & accounting
QuickBooks, Wave, Sage, Odoo → net margin, liquidity, collection period.
CRM & sales
HubSpot, Salesforce, Pipedrive, Zoho → win rate, sales cycle, growth.
E-commerce & marketing
Shopify, WooCommerce, Mailchimp → revenue growth, cart abandonment, engagement.
Slack, outbound
Strategenia posts a maturity summary to your channel: score, bottleneck, priorities.
Connect natively or via webhook, Make and Zapier. Every connection requires your consent (Law 25) and only numeric indicators are stored — never your transactions, invoices, or contacts.
Key features
- Multi-domain diagnostic and maturity heatmap
- Express track: a first picture and three priorities in 20 minutes
- Priorities calculated automatically
- Standalone accounts: each organization has its own private, walled-off workspace
- Team and roles: invite your colleagues as administrator, contributor, or viewer
- 24 integrations: QuickBooks, HubSpot, Shopify… natively or via Make and Zapier
- Weekly maturity summary in Slack
- Trajectory: your maturity history, the proof of movement over time
- Exportable PDF report, with a Law 27 lens (psychosocial risks)
- Meeting mode and document uploads
- Manage multiple organizations
- Data sovereignty and Law 25 compliance
Frequently asked questions
Do you need perfect data to get started?
No. Strategenia works by graceful degradation: you start with what your team knows, then corroborate with data as you go. A useful first picture takes shape in a single workshop.
Does it work without artificial intelligence?
Yes. Prioritization is deterministic and transparent: the same data always yields the same ranking. AI is only an optional aid, never a black box.
How long does a first picture take?
About twenty minutes with the express track, on your own. A few-hour team workshop yields a richer picture. Either way, the picture then sharpens with every cycle.
How do the integrations work?
Each connected tool pushes a few key indicators — net margin, win rate, revenue growth… — to the relevant cells of the reference model. You connect the source with your explicit consent (Law 25) and only numeric indicators are stored, never raw personal data. When a measured figure contradicts what the team declared, the gap automatically rises to the top of the plan.
Who on my team has access to what?
You own your organization and invite whomever you like, each with a specific role: administrator (manages the team and the data), contributor (assesses and feeds the picture), or viewer (read-only). No one else can access your workspace.
See it on your own organization
Create your private workspace in two minutes. The first 20 companies to sign up: first year free, before the beta closes.
Running a nonprofit? See the diagnostic designed for nonprofits — governance, funding, impact and sustainability.